Data becomes useful only when it is presented clearly to the right audience. Apart from presentation , instantly identifying network faults and performance makes IT admins' jobs more simple. All this can be done with the help of a network monitoring dashboard or a network management dashboard. OpManager, a comprehensive network management system has an extensively customizable dashboard that helps transform monitored data into actionable intelligence for the enterprise IT department. With over 90 widgets, this network management software offers an centralized network management console that allows the administrators to customize the dashboard to their requirements as well as scale it to meet whole IT management needs.
Users can make and set their own dashboard to be displayed as home page so as to know on critical metrics as soon as they log in. Consider the below server monitoring dashboard employed by a network performance administrator and see how he troubleshoots slow performance on the Order Processing System of the company:
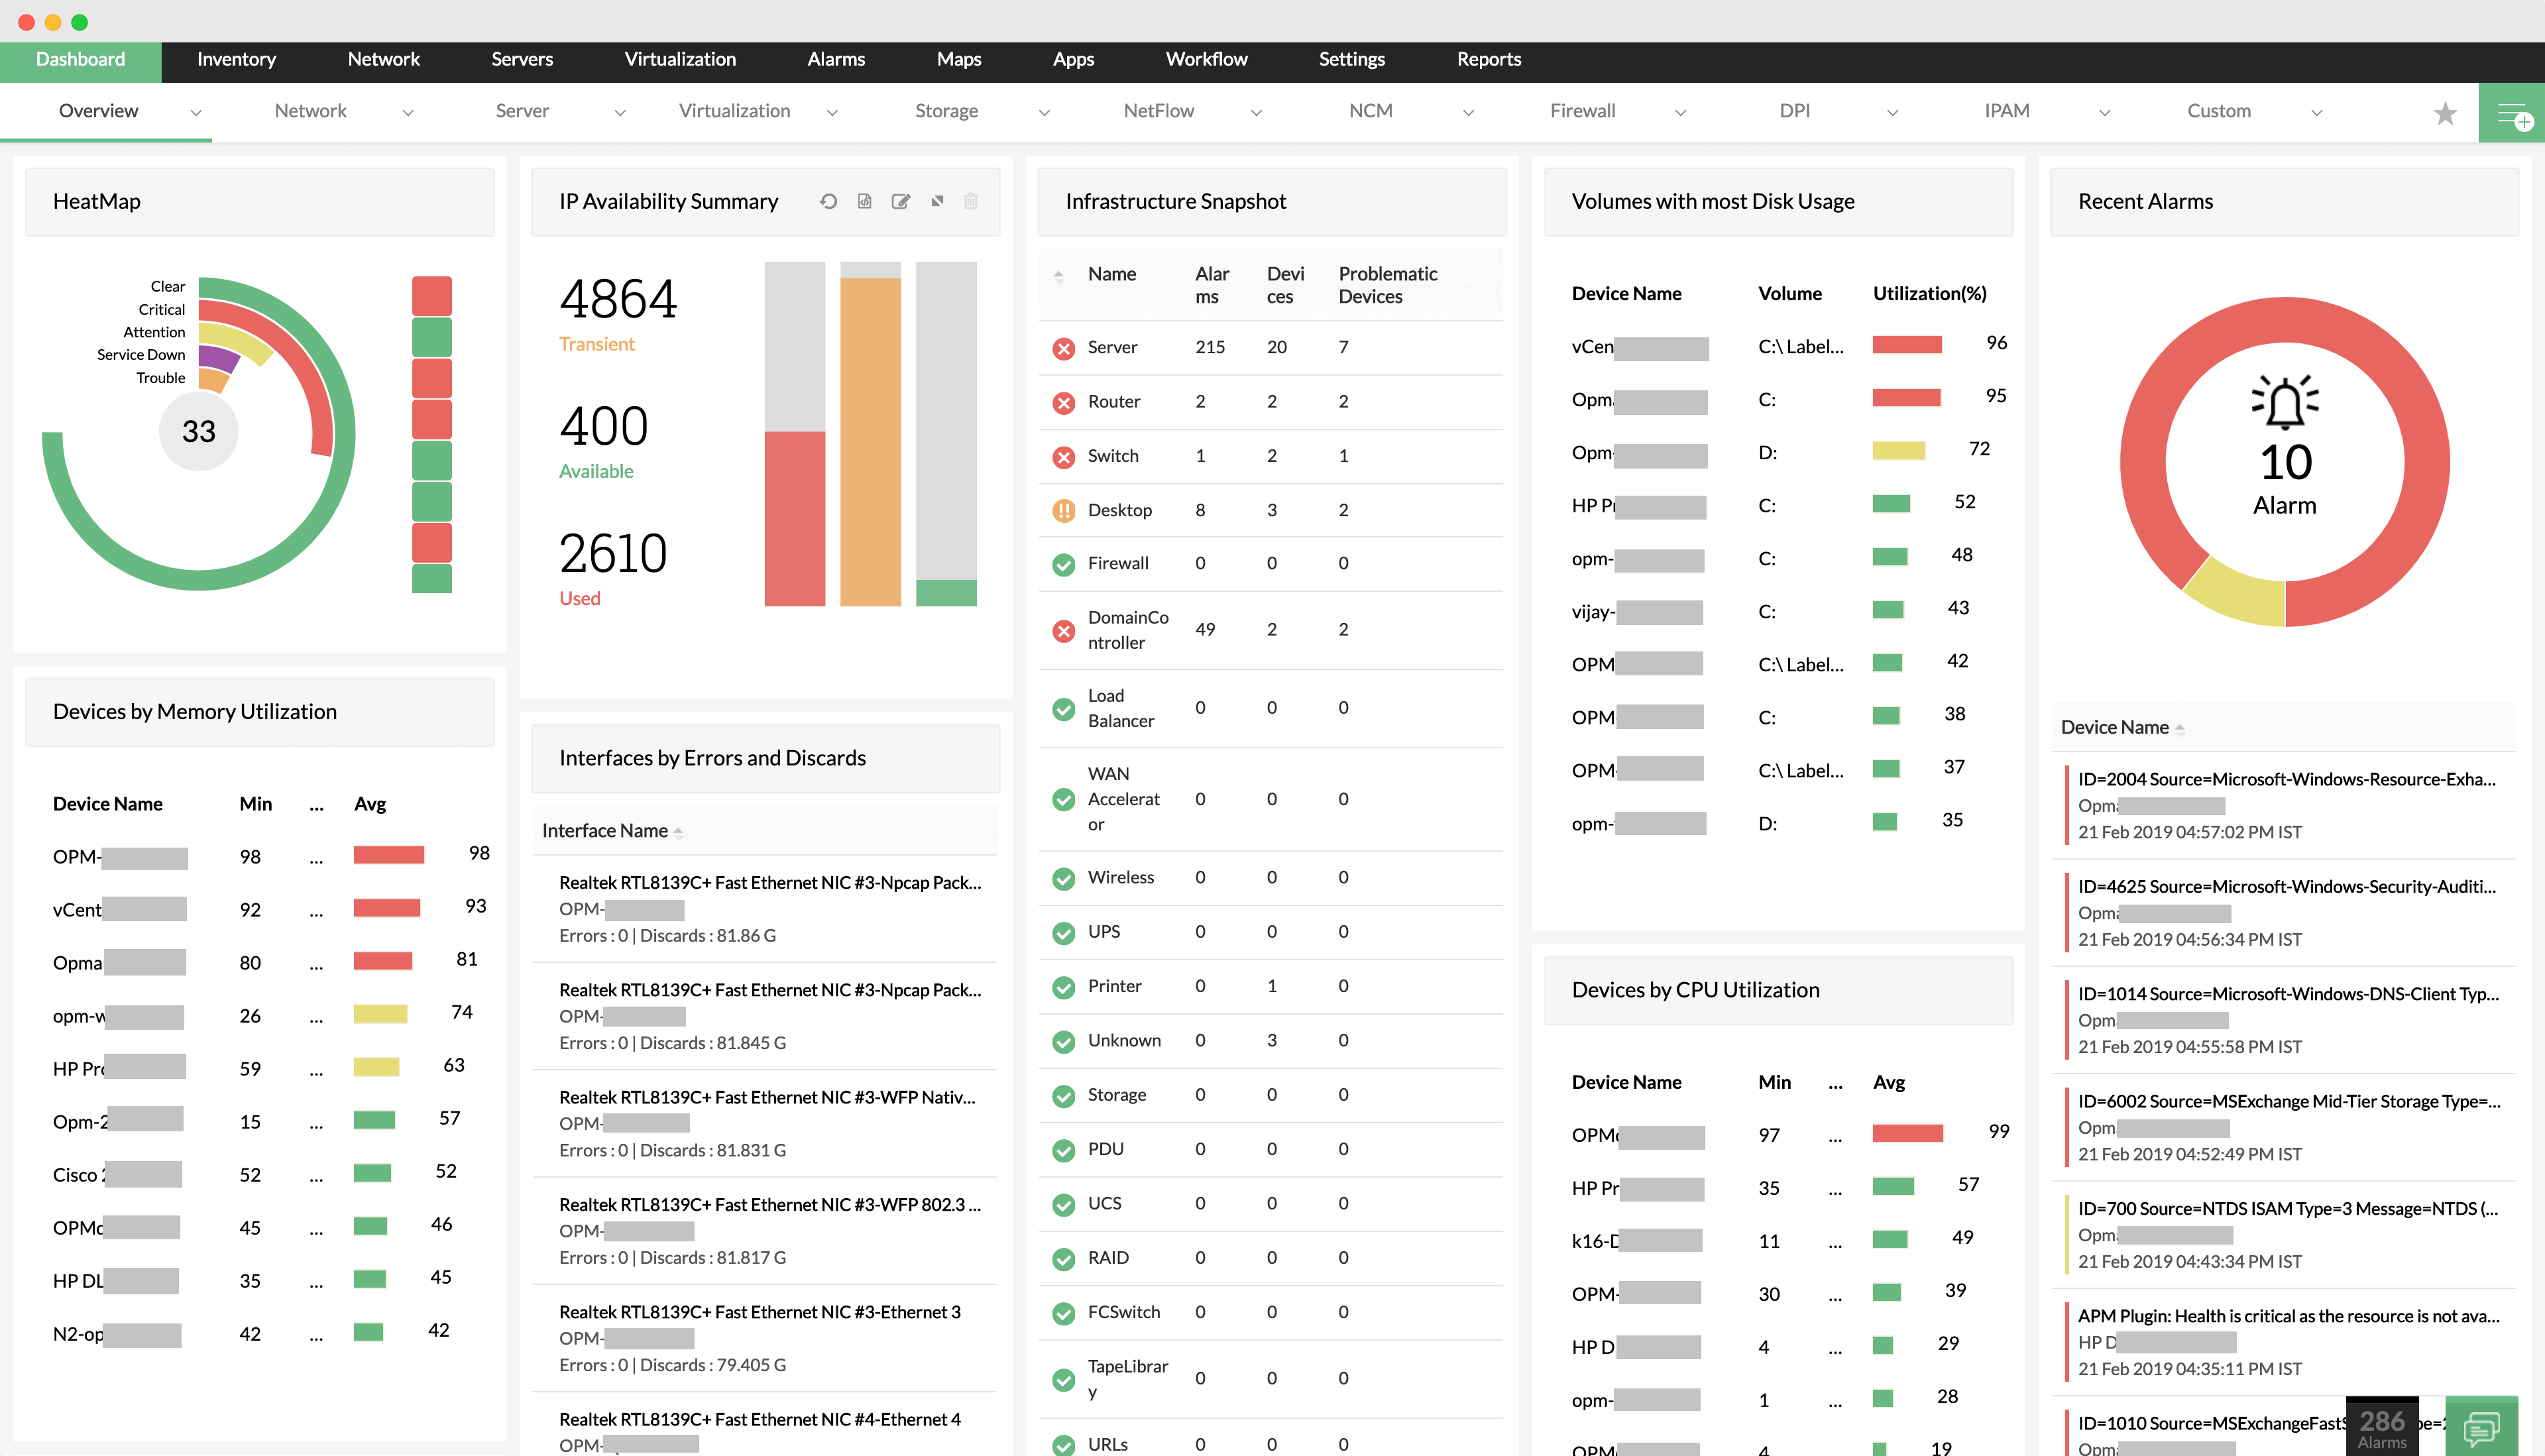
Clearly, it was high memory utilization in the OPS server that caused the unusual response time spike in the Order Processing System.
The network performance management dashboard provides an at-a-glance overview of the current status of your network, with critical metrics from routers, switches, firewalls, servers, services, application, URLs, printer, UPS and other Infrastructure devices. One-click data refreshment ensures you're always working with the most up-to-date information. With real-time performance graphs readily available, administrators can also quickly troubleshoot problem devices remotely.
The custom dashboard provides a powerful network management console containing: