Kafka is a popular distributed streaming platform used for messaging, queuing, and processing record streams in real time. With the exponential growth of data and the increasing complexity of Kafka deployments, ensuring the health and performance of your Kafka clusters is paramount. Since Kafka runs on multiple brokers and partitions across nodes, scales dynamically, and handles a large volume of data, the monitoring and management of Kafka clusters can pose a challenge.
Applications Manager offers production-ready Kafka monitoring that helps track the Kafka messaging ecosystem effectively and help organizations maintain high availability and efficiency in messaging and data transfer for seamless business operations. Designed to meet enterprise requirements, it reduces the time taken to resolve production issues, thereby allowing engineering teams to work more effectively in system deployment.
Whether you are a seasoned Kafka administrator or new to the ecosystem, Kafka monitoring tools like Applications Manager can provide the visibility and control you need to keep your Kafka clusters running smoothly. Applications Manager's Kafka monitor allows you to keep track of:
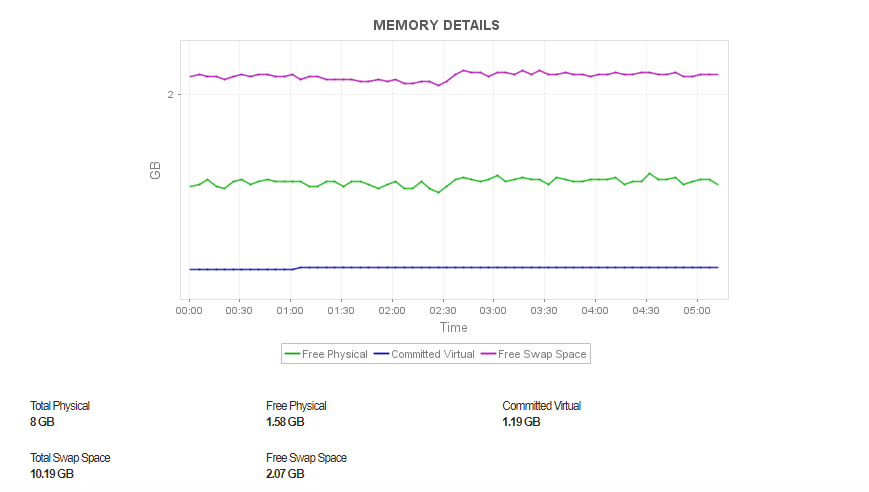
Obtain detailed insights into the resource usage statistics of your Kafka servers to get a clear idea of the utilization capacity of your Kafka server. Monitor key resource usage metrics, such as physical memory, virtual memory, and swap memory, to find out how much RAM your Kafka server is utilizing and get notified in case of a sudden increase in resource consumption. Also, get detailed stats on the JVM heap and non-heap memory of your Kafka server to discover how much data is being stored and to detect memory leaks, if any.
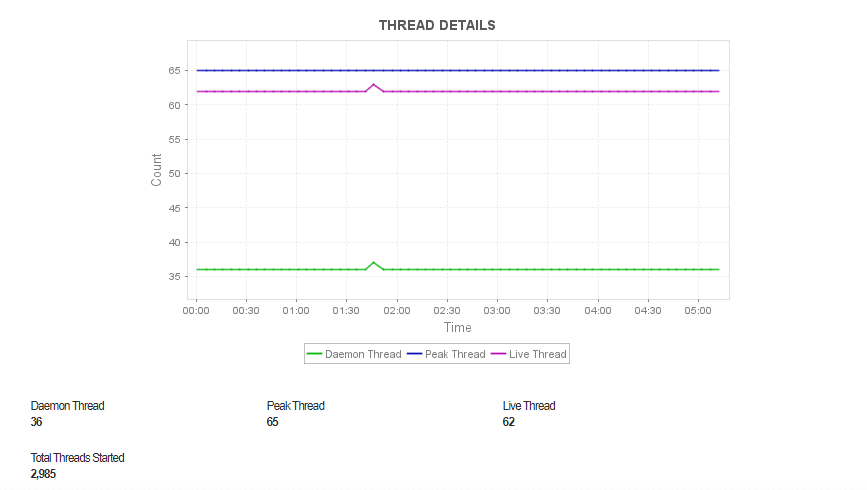
Keep a close eye on the threads that are used in your Kafka servers to handle multiple messaging requests and prevent bottlenecks, such as memory overloads, thread deadlocks, and thread starvation. Analyze thread details by tracking metrics such as daemon, peak, and live thread count to identify which thread is actually causing the issues in case of performance abnormalities.
Monitor the core metrics of your Kafka clusters and get in-depth visibility into the performance of the below components:
Get complete information on the topics that are running within the broker of a Kafka cluster, and configure alerts in case any topic is performing abnormally. Keep a close eye on key metrics of your topics, such as bytes in or out, messages in, and failed fetch or produce requests, and compare their performance across topics to make informed decisions about allocating resources or load balancing among topics.
Applications Manager monitors the following key metrics of Kafka topics:
| Parameter | Description |
|---|---|
| Log Details | |
| Log Flush Rate | The asynchronous disk log flush rate. |
| Broker Topic Metrics | |
| Bytes In / Min | The aggregate incoming byte rate (amount of data written to topic on this broker) per minute. |
| Bytes Out / Min | The aggregate outgoing byte rate per minute. |
| Bytes Rejected / Min | The amount of data in messages rejected by broker per minute. |
| Failed Fetch Requests / Min | The number of data read requests from consumers that brokers failed to process for this topic per minute. |
| Failed Produce Requests / Min | The number of requests from producer that have failed. |
| Messages In / Min | The number of Messages that comes into the Kafka broker. |
| Replication Manager | |
| IsrExpands / Min | The number of "in-sync" replica expansions. |
| IsrShrinks / Min | The number of "in-sync" replica shrinks. |
| Leader Count | The number of partitions for which a particular host is the leader. |
| Partition Count | The number of partitions in the cluster. |
| Under Replicated Partitions | This indicates the number of partitions in the cluster are under-replicated. |
| Request Handler Avg Idle Percent | The average fraction of time the request handler threads are idle. |
Obtain detailed information on the Kafka brokers that serve as the controller for managing the partitions, leaders, and replicas in a Kafka cluster. Keep track of active controllers to identify the broker that was the leader at the time the issue occurred in the cluster along with the exact count of offline partitions for quick troubleshooting and incident resolution.
Here are the key metrics of a Kafka controller that you need to keep an eye on:
| Parameter | Description |
|---|---|
| Kafka Controller Details | |
| Active Controller Count | Number of active controllers in the cluster. |
| Offline Partitions Count | The number of unavailable partitions. |
| Leader Election Rate | The rate of leader elections. |
| Unclean Leader Election Rate | The rate of Unclean Leader Elections. |
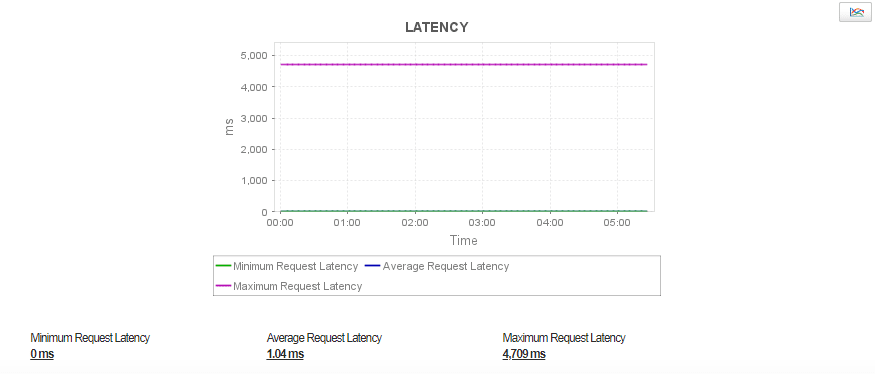
Obtain a comprehensive overview of the messaging details of your Kafka server and monitor the request throughput or total incoming and outgoing byte rate on your broker topics to identify possible bottlenecks and to take appropriate measures, such as implementing end-to-end compression for your messages, if required.
Here are the list of key metrics that need to be monitored in your Kafka network:
| Parameter | Description |
|---|---|
| Requests Process Rate | |
| Request Produce / Min | The number of messages written to topic on this broker. |
| Request Fetch Consumer / Min | The amount of data that the consumers fetched from this topic on this broker. |
| Request Fetch Follower / Min | The requests from brokers that are the followers of a partition to get new data. |
| Time Taken For Requests | |
| Total Time Produce / Min | The total time to serve the specified request. |
| Total Time Fetch Consumer / Min | The total time that the consumers fetched data from this topic on this broker. |
| Total Time Fetch Follower / Min | The total time that is taken by the followers of a partition to get new data |
| Network Processor Rate | |
| Network Processor Avg Idle Percent / Min | The average free capacity of the network processors per minutes. |
Get complete information on the topics that are running within the broker of a Kafka cluster, and configure alerts in case any topic is performing abnormally. Keep a close eye on key metrics of your topics, such as bytes in or out, messages in, and failed fetch or produce requests, and compare their performance across topics to make informed decisions about allocating resources or load balancing among topics.
Applications Manager monitors the following key metrics of Kafka topics:
| Parameter | Description |
|---|---|
| Topic Details | |
| Topic Name | Specifies the name of the topic. |
| Bytes in / Min | The aggregate incoming byte rate (amount of data written to topic on this broker) per minute. |
| Bytes Out / Min | The aggregate outgoing byte rate per minute. |
| Failed Fetch Requests / Min | The total number of failed Fetch Requests per minute. |
| Failed Produce Requests / Min | The total number of failed producer requests. |
| Messages In / Min | The number of messages that comes into the Kafka broker. |
Manage your Kafka clusters with Apache ZooKeeper by tracking clusters, brokers, and topic configurations, and also dealing with electing partition leaders. Since ZooKeeper stores metadata about Kafka’s brokers, topics, and partitions, and deals with administrative tasks such as electing partition leaders, keep a close eye on ZooKeeper metrics to prevent unwanted performance outages or slowness and to maintain a healthy Kafka cluster.
Streamline incident detection and resolution by identifying performance issues in Kafka clusters, such as consumer lag or offline partitions, and receiving immediate notifications via email, text, or Slack. You can send these alerts to external incident management tools, such as ServiceNow or ManageEngine ServiceDesk Plus. You can also respond quickly to incidents by automating corrective actions, such as using webhooks to start external actions.
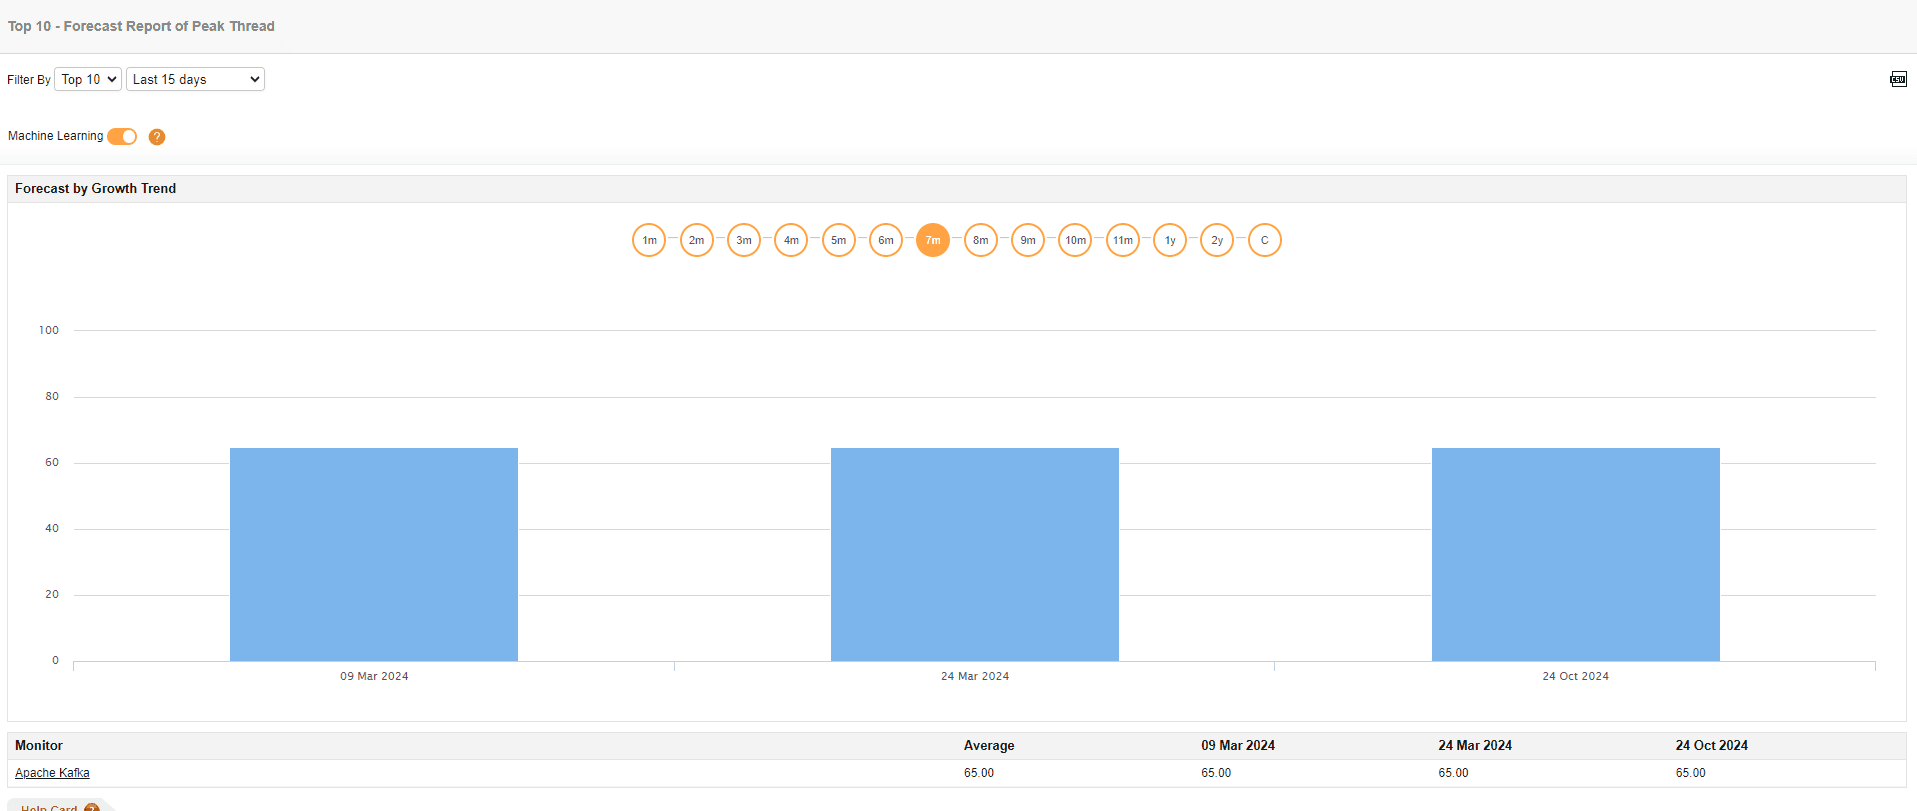
Leverage the power of machine learning for predictive reporting on Kafka cluster performance as well as AI-driven alerting and reporting capabilities to simplify Kafka performance monitoring and troubleshooting, ensuring uninterrupted business operations.
Kafka monitoring is the process of supervising the resource usage and underlying operations in Kafka to ensure its performance isn't affected. Kafka has grown considerably in terms of both volume and complexity, and being a crucial component in IT infrastructure, it's necessary to implement dedicated Kafka monitoring software—like ManageEngine Applications Manager—to track its operations, identify and resolve bottlenecks, and optimize performance.
Applications Manager's Kafka monitoring starts at $395/year to monitor up to 10 Kafka clusters. It is one of the most cost-effective monitoring solutions for your business and enables you to scale your monitoring as your Kafka deployment grows in size.
It's easy to set up Kafka monitoring with Applications Manager. Just enable JMX on the Kafka broker and set up the Kafka monitor in Applications Manager by specifying the JMX credentials, including username, password, JMX port, and JNDI path.
You can collect detailed metrics related to the health and performance of all the components of your Kafka cluster, such as:
Refer to our Kakfa monitoring help page to learn more.
It allows us to track crucial metrics such as response times, resource utilization, error rates, and transaction performance. The real-time monitoring alerts promptly notify us of any issues or anomalies, enabling us to take immediate action.
Reviewer Role: Research and Development

Tech Support Manager, Lexmark