In today's technological era, it has become more difficult for DevOps teams to have visibility into their application stack as service operations have become more distributed in nature. This has made it harder to know the full extent of a performance-related issue and how they affect the entire infrastructure. For example, performance metrics like 'Response time' and 'External Calls' tell us that an issue probably exists within the system but does not provide clarity into where exactly the problem can be found.
As modern applications employ a widely-distributed microservice approach for managing their IT operations, DevOps team often face a hard time trying to track, isolate, and debug performance issues before end-users get affected. The best one can do is find out the subsystem in which issue exists and then start digging deeper. However, this approach requires developers to dedicate a large amount of time and effort which can be redirected towards production and deployment efforts.
This is where distributed tracing comes into the picture. Through instrumentation, it has become possible for IT and DevOps teams to trace a request from start to end and correlate the distributed data to identify the exact spot where the application is struggling to perform.
Distributed tracing is a monitoring technique to understand the journey a request takes across your application stack. By using unique identifier tags, distributed tracing captures the performance information of each operation that the request passes through. This helps developers differentiate operations within a distributed system and how long it takes for each service to perform. Distributed tracing also maps the relationship across different operations within the application stack to draw a visual representation of the entire trace journey for easier debugging.
In a monolithic architecture, a birds-eye view is often sufficient for gaining application observability since the entire system operates as a single unit where all operations are local, executing a traceable number of functions at any given time. In this case, traditional tracing gets the job done as the request flows through a single system where all the components are coupled together.
However, applications built on a microservices architecture have a huge network of services that are interconnected to perform different operations. This approach is widely preferred by IT administrative teams that are looking for a flexible and easily scalable application environment. Since small development teams can manage each of the services, the microservices approach gives them the flexibility to implement new tech stacks for individual operations and use well-defined APIs to ensure seamless communication across each other. In addition, teams can also test and deploy updates without interfering with the operation of other services.
A microservices environment ensures independence across components that prevents the system from collapsing entirely. Instead, the issue would be isolated to a single operation that can be easily isolated and debugged without having a huge impact. However, this begs the question of how one can isolate such an issue.
Despite the many advantages that a microservices architecture offers, having such customization and flexibility also has its own flip side. Here's why:
For instance, a request might flow through a variety of services that are connected across different application environments;and each service might be handling tasks for various operations. So whenever a transaction occurs, a request might call multiple services one after the other. In such an event, if there is slowness in one of the services, subsequent operations get affected and they also slow down. This chain of events collectively increases the overall response time of the particular transaction or event, making it harder for IT administrators to point out where the issue originated from.
Using distributed tracing, DevOps teams can visualize the interaction and relationship between the services for granular information on the performance issue experienced by their application stack. Once they have identified the exact service that is taking too long to process, the relevant IT teams can be notified. They can then easily identify faults, debug them, and perform optimizations to their IT infrastructure for more efficient collaboration across microservices.
However, this does not mean that monoliths won't benefit from distributed tracing. A monolithic structure may also need distributed tracing to improve the speed and quality of debugging.
To understand how distributed tracing works, let us consider a scenario where a user is trying to login to their account in a web application:

When the user tries to login to their account, a HTTP request is generated from the front-end of the web application where it travels through a series of services to retrieve data from the database server. Let us consider that the HTTP request has to go through a chain of actions to execute the entire process completely. In this case, the HTTP request flow would be: front-end → service-1 → service-2 → service-3 → database server and travels back.
Let us consider a case where it has been found that the web application users had to wait a long time just to add the product to the cart. Such an event is certain to frustrate end-users who might exit the buying process, causing a huge impact on business operations and revenue. Upon inspection, developers can only learn about the response time of the transaction as a whole with no visibility into the operational efficiency of services involved.
Here, distributed tracing can be leveraged by collecting data at every step that the requests flows through until it reaches the end-point. By analyzing distributed tracing data, DevOps teams would be able to visually identify the specific service that has taken a large chunk of the response time and has led to a huge increase in the overall response time.
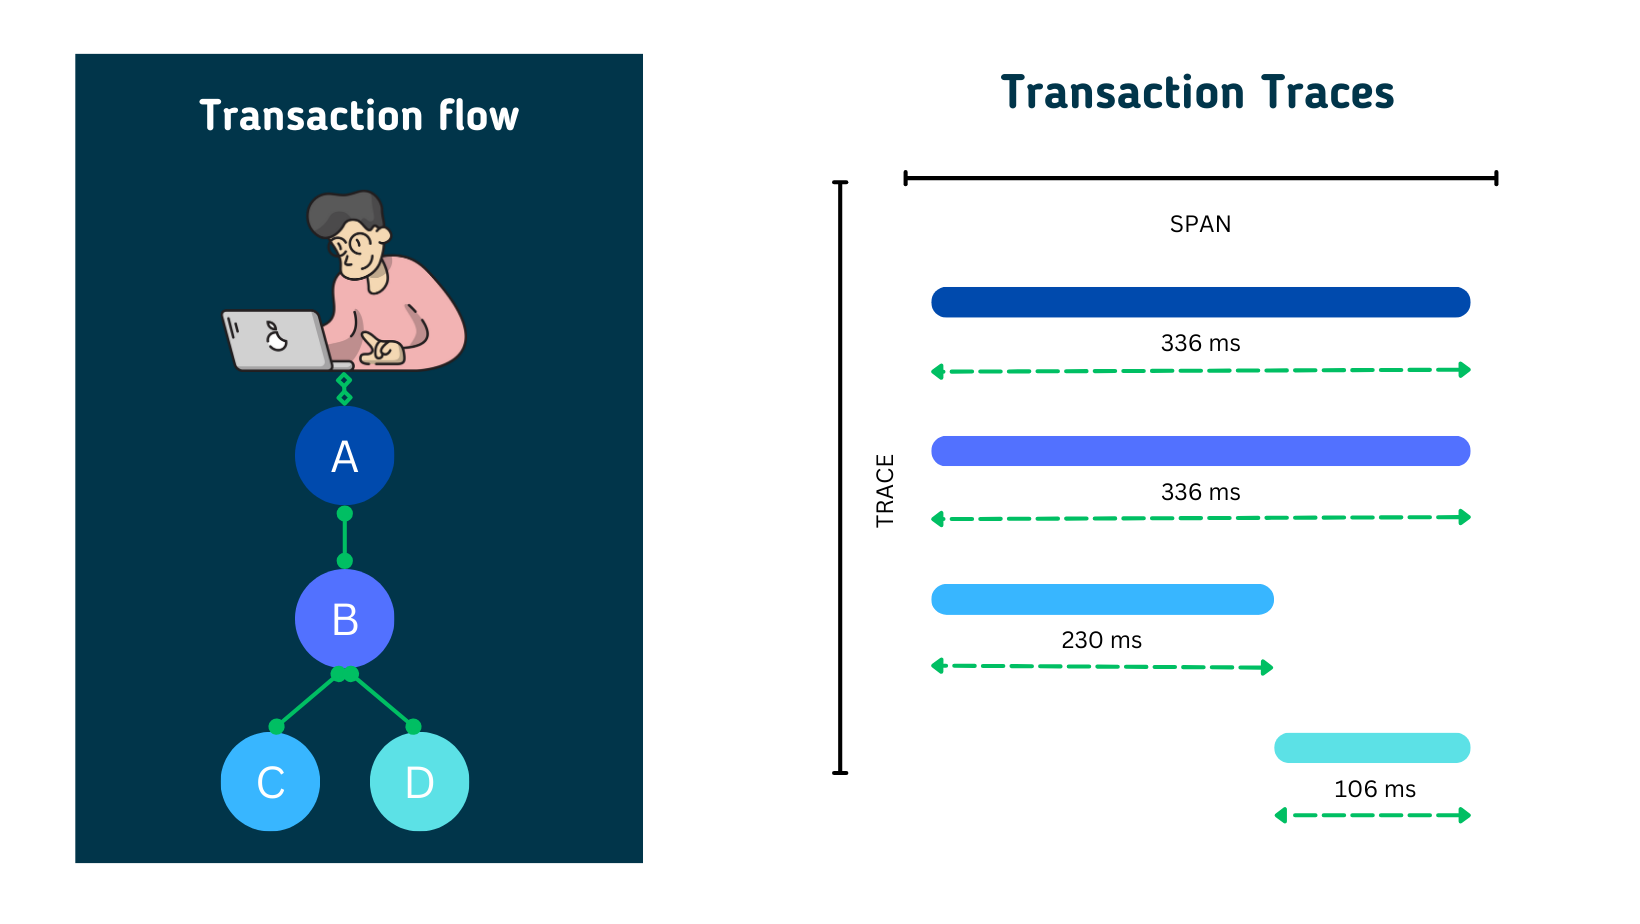
Based on the above scenario, distributed tracing works by assigning a Trace ID to the request such that it follows through the services and the database server. The span for each service is calculated based on the time it takes for them to receive a request and complete it fully.
As such, span D represents the moment the HTTP request is received by the server from service-3. Whereas span C starts when a request is sent to the database server and ends when a response is received. Similarly, span B ends when the HTTP response is received by service-2 and span A ends when the HTTP response is received by service-1. In this scenario, A would be the parent span of child span, B. Similarly, B would be the parent span C and so on.
When a sudden rise in response time of a transaction is detected, IT administrators can follow the traces of each span. Upon going through each span, they would find that all the spans from A to C would have a high response time while span D is free of abnormalities. As C would be the bottom-most child span, troubleshooting the issue at this stage would generally solve the issue as the parent spans are only dependencies. This issue could be due to multiple reasons like traffic spike, usage surge, bugs, errors, job overlaps, and more.
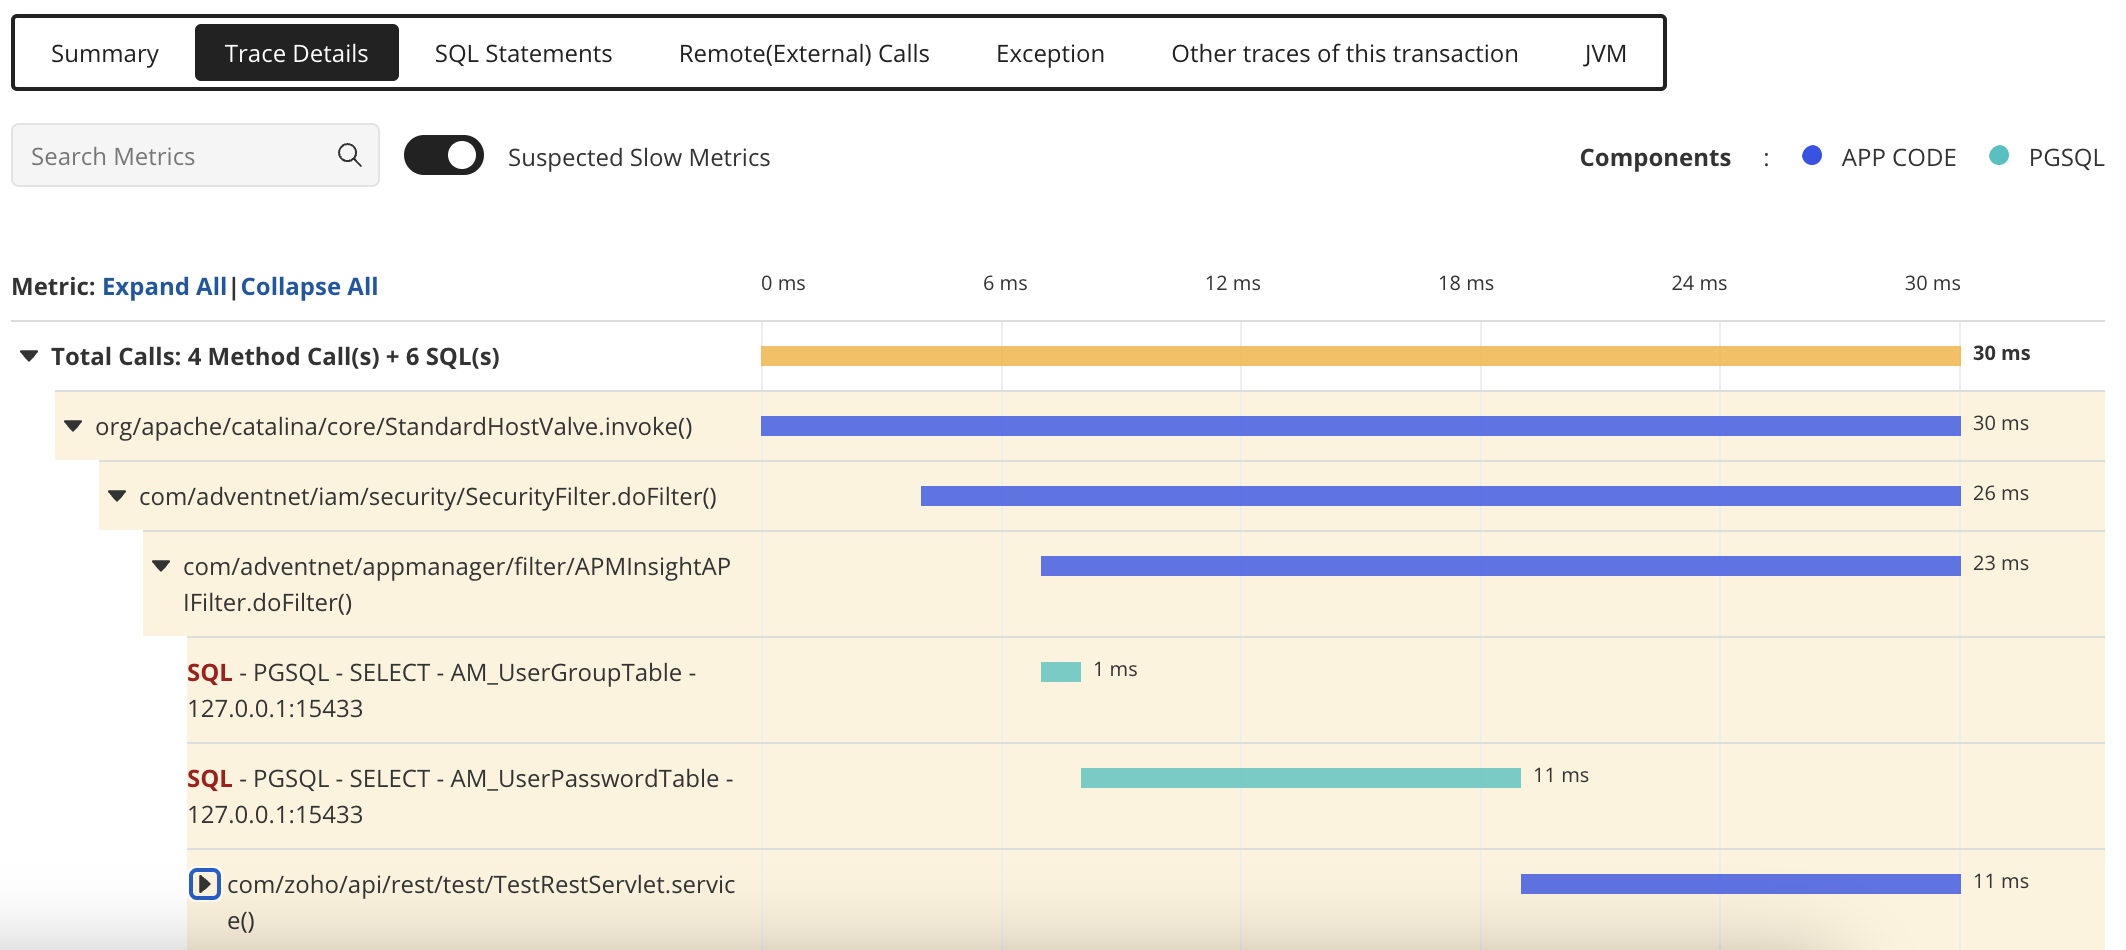
Now, if an entire action takes too long to execute, a system that performs distributed tracing is typically used to collect important performance metrics at each service. Using an application performance monitoring tool like Applications Manager, you can perform distributed tracing to get a visual breakdown of each span and find out where it is lagging.
With just a few simple steps, it is easy to download Applications Manager and configure it in your system. On the dashboard panel, you can create a new monitor for web applications that run on either Java, node js, .Net, Ruby on rails, Python, PHP, or .Net core. Once you have set up your own application monitor, performing distributed tracing is a cakewalk.
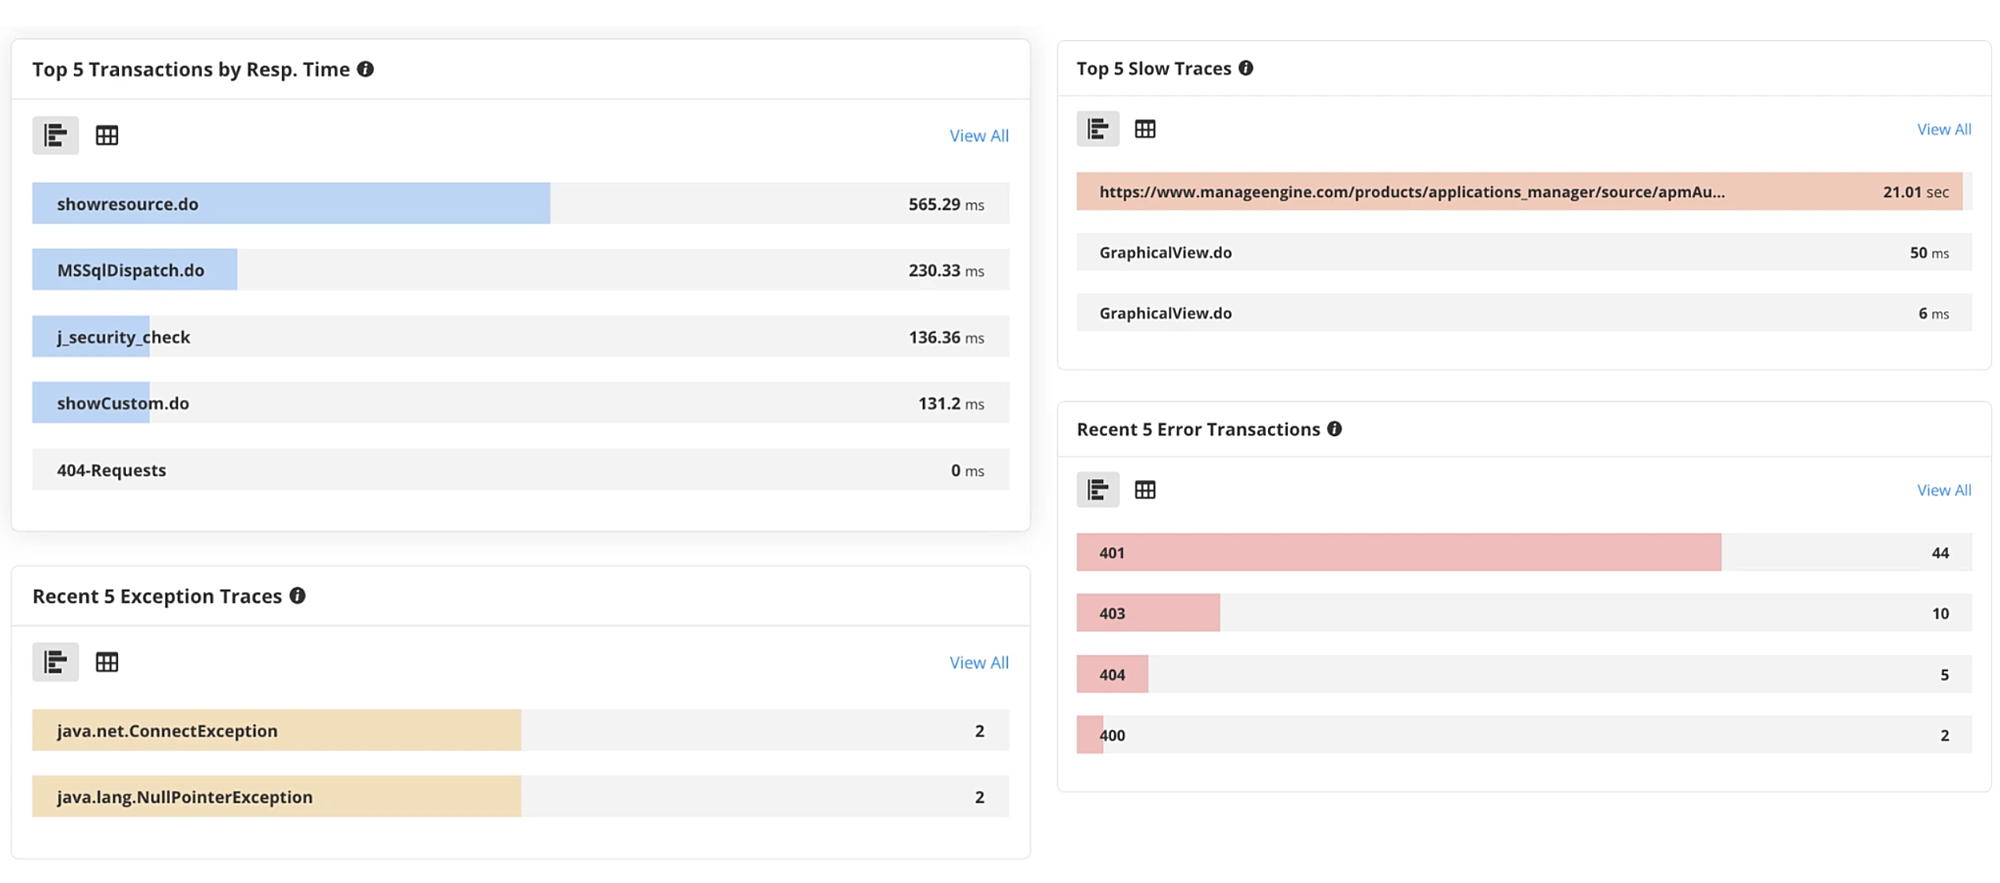
Applications Manager has a dedicated 'APM' panel which consolidates all the application monitors in one place. By navigating through each application monitor, here's how you can perform distributed tracing with Applications Manager:


Having an application performance monitoring tool with in-built distributed tracing capabilities has the following advantages:
Faster troubleshooting - Since teams can see through the entire transaction trace steps, it becomes easier to identify faulty components. Developers won't have to run through each log and spend hours on debugging. Instead they get instantly notified where they need to focus on, and directly get to work. This reduces the MTTR significantly, thereby lowering downtime. For example, if adding to the cart is the issue, distributed tracing can help the backend performance issue there.
Improved productivity through team collaboration - As microservices are usually managed by different teams, distributed tracing helps identify the specific service module that requires attention. This way, when one team is facing an issue in their entire request flow, they can identify and notify the relevant team which is responsible for the cause of slowness. They can then help fix the issue.
Flexibility - Employing distributed tracing into application management strategy can make it easier for organizations to scale whenever needed. This allows them to expand their microservices environment with new service operations without hesitation, since they have the backing of distributed tracing.
Improve end-user experience - Whenever an end-user has difficulty navigating through a web application, more often than not, the issue would generally originate from a single service operation. As a result, the entire process slows down affecting the satisfaction level (APDEX score) of application users. Distributed tracing is one way to zero down on the issue without letting it affect the digital experience of your end-users.
As more web applications are moving towards a microservices architecture, it becomes essential to also have distributed visibility. With distributed tracing, IT and DevOps teams can identify, optimize, and troubleshoot issues to ensure a reliable service environment across their application stack. It gives them the confidence to make informed decisions on performance optimization and address issues at a faster rate.
In short, distributed tracing is one of the core elements that instrumentation tools should offer in order to get a complete picture of interdepencies within an application stack. Applications Manager is one such tool that infuses distributed tracing with application performance monitoring which can be effectively used by enterprises to make sure business applications meet end-user expectations.
Get started now by downloading our 30-day free trial to experience all the features of our monitoring solution or schedule a personalized demo for a guided tour.

It allows us to track crucial metrics such as response times, resource utilization, error rates, and transaction performance. The real-time monitoring alerts promptly notify us of any issues or anomalies, enabling us to take immediate action.
Reviewer Role: Research and Development